California Precipitation Data

Access historical and current precipitation data across all regions of California. Download, visualize, and analyze rainfall patterns.

Download Data

California Monthly Data Visualization

The visualizations below display precipitation patterns across California for the months of February, March, and April 2025, respectively. These heat maps represent rainfall intensity and distribution derived from regional meteorological sources.

California precipitation data and climate datasets for February 2025 showing monthly rainfall trends and historical precipitation levels

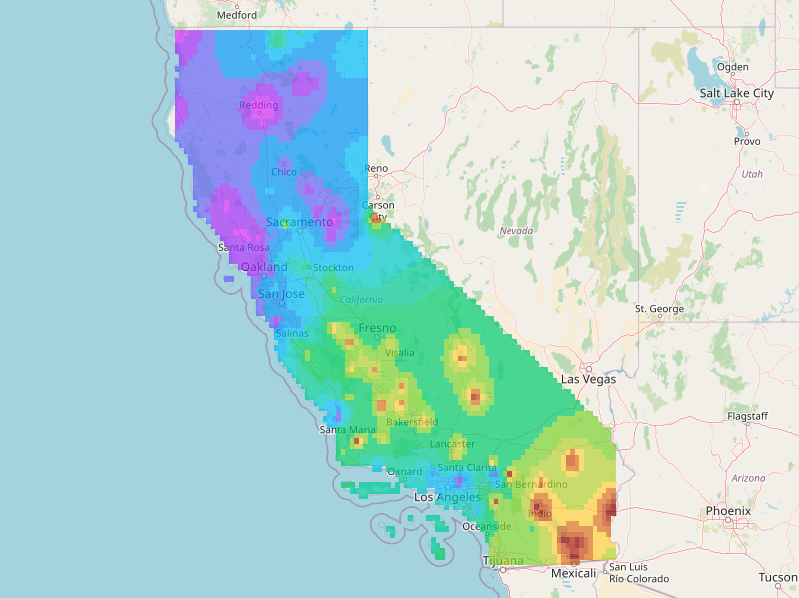
February 2025: Initial winter precipitation with concentrated rainfall in the central and northern regions.

California precipitation dataset and rainfall data for March 2025, showing climate trends and monthly rainfall intensity

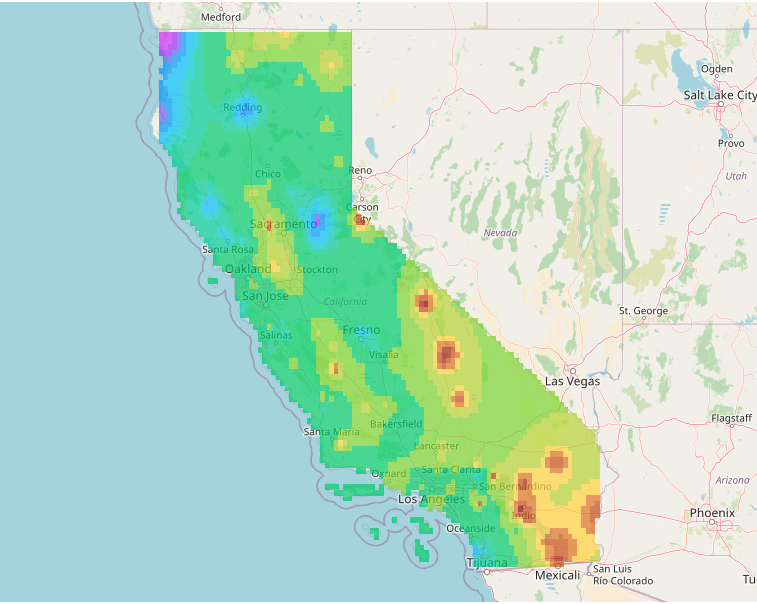
March 2025: Widespread and intense rainfall, marking the peak of the rainy season.

California precipitation dataset and rainfall data for April 2025, highlighting post-peak rainy season climate conditions

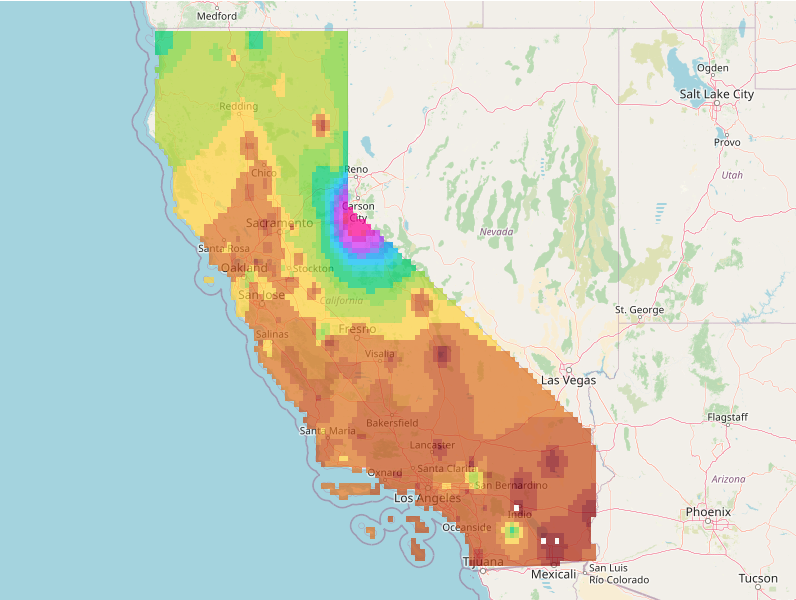
April 2025: Tapering off of precipitation, with some localized rainfall in southern areas.

These visualizations represent sample data. Download the latest datasets to generate up-to-date visualizations.

Request Precipitation Data

Contact our team to request custom data extracts tailored to your specific research or planning needs. The more details you provide about your requirements, the better we can assist you.

Coverage Area

All California regions, counties, and watersheds

Email

info@watermetrics.org

Data Team

Our specialists respond within 1-2 business days